Blog
Books
Media
Courses
Categories
All
(139)
100DaysOfPolars
(101)
business
(1)
data analysis
(7)
Finance
(1)
rust
(3)
visualization
(4)
Advanced pivot tables with polars
Sometimes group by does the trick
As a data professional, it’s inevitable that you’ll end up creating a pivot table. Stakeholders love pivot tables, and they won’t pass up a chance to request one from you.…
2026-07-03
Joram Mutenge
How the 52-week high/low can guide your investment choice
Investing is not an easy activity. If it were, we would all be Warren Buffett rich! I’ve been reading investment literature to better understand what this rich-people…
2026-06-09
Joram Mutenge
Slicing and dicing pandas & polars dataframes
How to select subsets of rows and columns
A few years ago, I read an article on pandas’
loc
method by Matt Harrison, published on the now-defunct Ponder website. I loved reading it because it showed, in depth, the…
2026-06-08
Joram Mutenge
Don’t Write Polars Code with a Pandas Accent
JORAM MUTENGE
2026-05-16
Convert quarto revealjs slides to pdf
Without losing styles and formatting
A few days ago, I needed to create slides for a PyCon talk I’ll be giving on May 16 in Long Beach, California. Since I was going to be showing a lot of code in my talk, I…
2026-05-10
Joram Mutenge
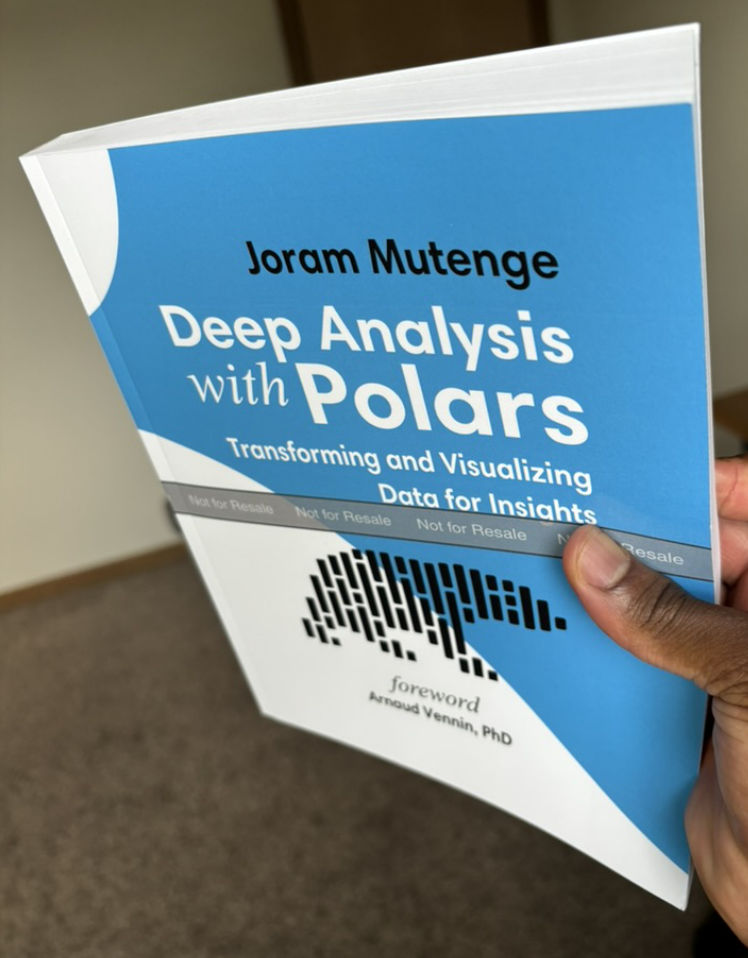
Writing my polars book
The process and tools used
I’ve written a few books under my name, but
Deep Analysis with Polars
is the first technical book I’ve ever written. Let’s just say I didn’t know what I was getting myself…
2026-04-18
Joram Mutenge
Understanding structs in rust
Custom data types
A struct in Rust is a custom data type that lets you group related data under a single name. By default, structs have no methods, but you can add them using
impl
blocks.…
2026-02-07
Joram Mutenge
An uncomfortable business lesson from The Apprentice
Why Georgina Newton got fired
Yesterday, I watched the first episode of
The Apprentice
season 20. I’m an avid fan of the show because it not only entertains me, but also teaches me business lessons. In…
2026-01-30
Joram Mutenge
Equalities with nulls in polars
When null values interfere with filtering
Recently at work, I discovered something unexpected when filtering values with Polars. Below is a dataframe showing students’ weekly quiz results.
2026-01-21
Joram Mutenge
Did you know polars can execute fizzbuzz?
I didn’t know too, until I tried
As a huge fan of the Polars data analysis library, I often find myself testing its capabilities to their limits. For example, I wanted to see whether I could implement the…
2026-01-15
Joram Mutenge
All the movies and series I watched in 2025
And how to calculate the Mutenge score
If someone asks about your hobbies, do you tell them something that makes you seem smart or cool, or do you tell the truth? If a hobby is what you spend most of your free…
2025-12-31
Joram Mutenge
Formatting dates in polars
dt.strftime
The representation of dates in data varies from region to region. In the USA, for instance, dates begin with the month rather than the day. Polars allows you to change how…
2025-12-23
Joram Mutenge
From JSON to tabular data with polars
pl.json_normalize
JSON data obtained through an API call can be nested at multiple levels, making it difficult to analyze. Fortunately, Polars can read JSON data at multiple levels, ensuring…
2025-12-22
Joram Mutenge
Count the occurrence of some text in a string in polars
count_matches
You have a table of passwords and, for some reason, you want to count the number of digits in each password. This is possible using Polars. Below is a dataframe of passwords.
2025-12-21
Joram Mutenge
Collapse rows into a single row in polars
str.join
Polars allows you to collapse multiple rows into a single row, combining the values from all the rows into one. Below is a dataframe showing parts of a phone number.
2025-12-20
Joram Mutenge
Rounding down time in polars
dt.truncate
Polars allows you to round down datetime values, similar to how you would round decimal values–well, almost. Below is a dataframe showing time series data.
2025-12-19
Joram Mutenge
Use title case on text in polars
to_titlecase
You have a table with authors in one column and the books they wrote in another. However, the book titles are all in lowercase, which is not the standard formatting for book…
2025-12-18
Joram Mutenge
Group by on time series in polars
group_by_dynamic
Group by operations are powerful in Polars, but when working with time series data, you can make them even more effective by using
group_by_dynamic
instead of the standard
gr…
2025-12-17
Joram Mutenge
Replace time zone in polars dataframe
dt.replace_time_zone
If you are working remotely and your team spans multiple time zones, it is important to ensure that the data you are analyzing matches the time zone in which it originated.…
2025-12-16
Joram Mutenge
Filter rows in polars dataframe
filter
If you are analyzing data with Polars, it is almost impossible to complete an analysis without filtering. Data analysis usually involves selecting some rows from a dataframe…
2025-12-15
Joram Mutenge
Extract the first few characters of text in polars
str.head
Sometimes you may need to extract the first five or seven characters from a text value. This is useful when working with long strings. The following example uses a dataframe…
2025-11-24
Joram Mutenge
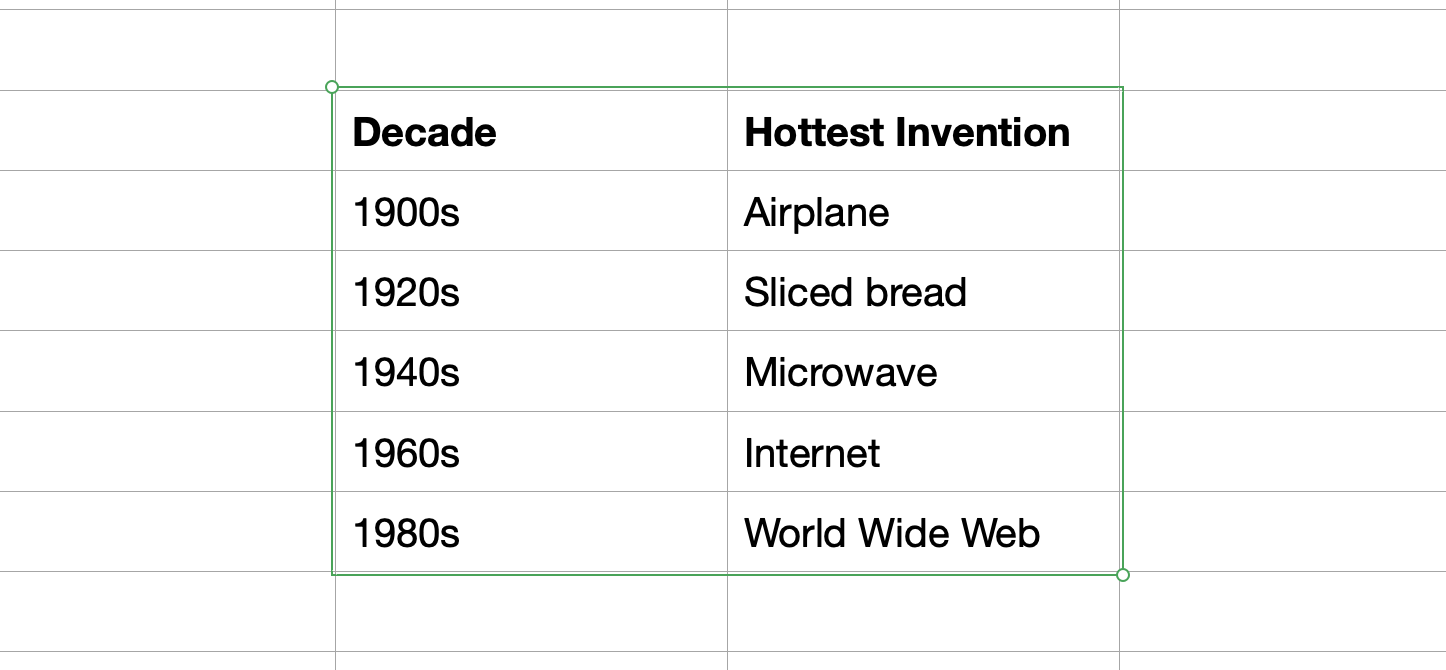
From date to century in polars
dt.century
You are querying a historical database that contains dates, and you want to create another column that indicates the century for each date. The dataframe below shows a set…
2025-11-23
Joram Mutenge
Get schema of parquet file without reading data in polars
read_parquet_schema
You have a large Parquet dataset and want to determine its columns and their data types. However, you do not want to read the entire dataset just to retrieve this…
2025-11-22
Joram Mutenge
Performing set difference in polars
anti join
Polars provides a special type of join that lets you retrieve items in dataframe 1 that do not have a match in dataframe 2. This works like set difference in mathematics.
2025-11-20
Joram Mutenge
Get the index of unique values in a polars dataframe
arg_unique
You have a table with repeating names, and you want to get the index where each unique name appears. Below is a dataframe showing students and their grades on various tests.
2025-11-19
Joram Mutenge
Assign column names while reading the file
new_columns
Most people read a CSV file with poorly named columns and then rename them afterward. If you’re one of those people, stop doing that. Below is a dataframe showing a CSV file…
2025-11-18
Joram Mutenge
From date to timestamp in milliseconds
dt.timestamp
Sometimes you may want the date value in your dataframe to display as a timestamp. This is useful when you need to hide the date of birth (DOB) of people in your dataset…
2025-11-17
Joram Mutenge
Changing data types while reading the file in polars
schema_overrides
Most people read CSV files and then change the data type of columns. That is an amateur way of doing it. The professional approach is to do it all at once. Below is a…
2025-11-13
Joram Mutenge
Count number of days between dates in polars
total_days
Counting the number of days between dates is a common calculation in data analysis. Below is a dataframe showing start and end dates.
2025-11-12
Joram Mutenge
Counting bytes in text in polars
len_bytes
The number of characters in text is not always the same as the number of bytes, especially when the text contains emojis. Below is a dataframe showing YouTube comments.
2025-11-11
Joram Mutenge
Padding at the end of a string in polars
pad_end
You have part numbers for your products, and you want to ensure they all have the same length, meaning they contain the same number of characters. Below is a dataframe that…
2025-11-10
Joram Mutenge
Create hierarchy on text data in polars
Enum
Polars has a special data type that allows you to filter text values based on hierarchy. Let’s create a dataframe where the
Degree
column is of the data type
Enum
.
2025-10-29
Joram Mutenge
Move dates back and forward in polars
offset_by
Sometimes, you may want to change the dates of your appointments, either moving them forward or backward. Below is a dataframe showing your appointments.
2025-10-28
Joram Mutenge
Get the chance of all events happening at once in polars
cum_prod
Probabilities are all around us, and if you work in the data field, you’re bound to encounter them. For example, what are the chances that you’ll get into Harvard, become a…
2025-10-27
Joram Mutenge
Get indices for a specific value in a polars dataframe
arg_true
Sometimes you may want to get the index positions of a repeating value in a Polars dataframe. Below is a dataframe showing students and their grades.
2025-10-26
Joram Mutenge
Count null values in every column in polars
null_count
Everyone working in the data field knows that data is never perfectly clean, and missing values are almost inevitable. That’s why it’s important to check whether your…
2025-10-25
Joram Mutenge
Unnesting values in a polars struct
unnest
Polars has a special data type called
struct
, which is useful for storing data efficiently without using too much memory. However, performing tabular operations on structs…
2025-10-24
Joram Mutenge
Reverse values in a polars dataframe
reverse
Polars allows you to reverse the values in your dataframe so that the last row becomes the first. Below is a dataframe showing the itinerary of a businessperson like yourself.
2025-10-23
Joram Mutenge
Get a value in a specific cell of a polars dataframe
item
Polars allows you to target a dataframe down to a specific value, such as selecting a value from a particular cell in the table. Below is a dataframe showing streaming…
2025-10-22
Joram Mutenge
Get row as dicitonary from polars dataframe
row
The Polars dataframe is highly accessible. In fact, you can get a row as a dictionary and use it directly in your Python code. Below is a dataframe showing clothing brands.
2025-10-21
Joram Mutenge
Group numerical data into categorical buckets in polars
qcut
If you’re a movie buff like me, you probably subscribe to multiple streaming services. Suppose you wanted to categorize the cost of your subscription fees for these services…
2025-10-20
Joram Mutenge
Grouping with over in polars
over
Group by operations usually reduce the size of a dataframe, both in the number of columns and rows returned. However, sometimes you may want to maintain the original…
2025-10-19
Joram Mutenge
Insert a column into a polars dataframe
insert_column
Polars allows you to insert a column into a dataframe at any position you want. Below is a dataframe showing the ratings of some unknown movies.
2025-10-13
Joram Mutenge
Get a column’s index position in polars dataframe
get_column_index
Your table has many columns, and you want to know the position of a specific column in the table. How can you do that? Below is a dataframe showing cereal brands.
2025-10-12
Joram Mutenge
Stack polars dataframes side by side
hstack
If you have two tables with the same number of rows, you can combine them side by side to create a single table. Below are two dataframes to be combined.
2025-10-11
Joram Mutenge
Pivot data without any aggregation in polars
unstack
You have a table with four rows and want to turn it into a table with two rows. In other words, you want to transform a long-format table into a wide-format table, which…
2025-10-10
Joram Mutenge
Store values from a row into a single column
transpose
For presentation purposes, you may want to have the values from a row stored in a single column. Below is a dataframe showing electronic gadgets.
2025-10-09
Joram Mutenge
Change numbers from positive to negative and vice versa in polars
neg
You want to understand what makes your life better, so you start assigning a Collins score to each day to gain insights from your high-scoring days. However, after five…
2025-10-08
Joram Mutenge
Divide with no remainder in polars
floordiv
In programming, division comes in two forms: with a remainder and without a remainder. In most programming languages, the symbol
/
represents division with a remainder, while
…
2025-10-07
Joram Mutenge
Use clip to set upper and lower bound values in polars
clip
Imagine you’re a teacher who isn’t satisfied with the range of grades your students received on what you thought was a fairly easy math test. You want to set the lowest…
2025-10-06
Joram Mutenge
Converting from polars to pandas dataframe is as easy as 1, 2, 3
to_pandas
Almost anything you can do in Pandas can also be done in Polars. However, there are certain outputs that are unique to Pandas, such as creating a hierarchical column table.…
2025-10-05
Joram Mutenge
Replace null with next value in polars
backward_fill
Anyone working with data knows that encountering null values in a dataset is inevitable. There are several ways to fill null values in Polars. One approach is to replace…
2025-10-04
Joram Mutenge
Store dataframes in a list by alignment in polars
pl.align_frames
You have two dataframes and want to store them in a list based on shared values in one column. Below are two dataframes; one with movie ratings and the other with duration.
2025-10-03
Joram Mutenge
Convert a polars dataframe to a Python dictionary
to_dict
Dictionaries are an important data structure in Python. They’re used everywhere from storing data retrieved from web requests to keeping values in a lookup table by key.…
2025-10-02
Joram Mutenge
Count unique values in a column in polars?
n_unique
Knowing the cardinality of columns in your table is important. What’s cardinality? It’s the number of unique values contained in a column. If a column has many unique…
2025-10-01
Joram Mutenge
Calculate moving average in polars
rolling_mean
You’re running a store and want to know the average of your sales every 3 days to track whether your sales are dipping. Below is a dataframe showing sales on specific…
2025-09-30
Joram Mutenge
Filter data with any in polars
contains_any
You’re a teacher who has just finished grading student exams, and you want to identify the students who either got a C or a D so that you can talk to them about their poor…
2025-09-29
Joram Mutenge
Becoming a triple threat data professional
The 3 languages you need
The data field is becoming increasingly competitive because many people are switching careers to join it. Back in the day, you only needed to know one language, like SQL or…
2025-09-28
Joram Mutenge
Remove suffix in column names in polars
name.map
You may have a table with long column names that contain suffixes like “Undergraduate_Student”, where the suffix is “_Student”. These long column names can be difficult to…
2025-09-27
Joram Mutenge
Replace all occurrence of specific text in polars
replace_all
When working with text data, replacing characters with other characters is common. However, most replacements are applied only once. For example, if you have “barb” and…
2025-09-26
Joram Mutenge
Create pivot tables in polars
pivot
Excel is known for pivot tables, but did you know that you can create pivot tables in polars too? That’s how versatile polars is. Below is a dataframe of students and their…
2025-09-25
Joram Mutenge
Use custom functions as dataframe methods in polars
pipe
Chaining operations in polars is encouraged to take advantage of the query engine in the backend. However, you may want to apply a function that is too specific to your…
2025-09-24
Joram Mutenge
Can you do FizzBuzz in rust?
3 methods and a gotcha to avoid
You can’t claim to know a programming language if you can’t answer the FizzBuzz problem with that language.
2025-09-23
Joram Mutenge
Speed up analysis with lazyframes in polars
scan_csv
Datasets are getting bigger, which means loading the entire dataset into memory can put a strain on your computer. Fortunately, Polars allows you to scan data and store it…
2025-09-22
Joram Mutenge
Pad the start of values with zeros in polars
zfill
You have a shop and want your receipt numbers to have four digits instead of just one. So rather than receipt “No. 1”, you want receipt “No. 0001”. Below is a dataframe…
2025-09-21
Joram Mutenge
Remove leading whitespace from text values in polars
strip_chars_start
Your data may contain leading characters like spaces or tabs due to bad user input. Below is a dataframe showing values with leading whitespace.
2025-09-20
Joram Mutenge
Convert your data from wide to long format in polars
unpivot
Wide-format data (data with many columns) is good for presentation, but for computation, long format is best. That’s what computers love! Below is a dataframe showing…
2025-09-19
Joram Mutenge
Easily convert text to date values in polars
to_date
Usually, when you want to convert string (text) data to a date type, you have to introduce some esoteric formatting like “%m%d%Y”. Unfortunately, this looks like gibberish…
2025-09-18
Joram Mutenge
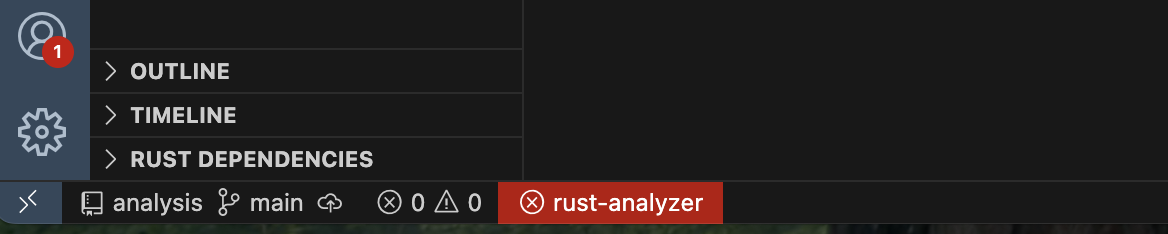
How to solve the rust analyzer failure
VSCode extension
Rust is hot right now. Everyone wants to learn it, or at least that’s what they say. I’m in love with the language too, and recently I convinced myself that it would be a…
2025-09-17
Joram Mutenge
The python documentary was worth watching
My reflections after watching
I’m not one of those people who started programming when they were nine. At that age, I had much more fun things to do, like playing in the dirt and catching grasshoppers in…
2025-09-14
Joram Mutenge
Deleting a record in a polars dataframe
remove
Deleting records from a table is a common operation when analyzing data. Suppose you have a dataframe of lawyers and the scores they received on their bar exam.
2025-09-13
Joram Mutenge
Creating dummy variables in a polars dataframe
to_dummies
Computers process numerical data faster than text data. That’s why it’s a good idea to convert text data into numerical data when training machine learning models. You want…
2025-09-12
Joram Mutenge
Adding an index to a polars dataframe
with_row_index
Ritchie Vink, the creator of Polars, once wrote something like this in a post (probably on Reddit):
2025-09-11
Joram Mutenge
Moving rows up or down in polars
shift
When working with timeseries data, you may want to move values in a column a few rows up or down. This is particularly important when calculating moving averages, where the…
2025-09-10
Joram Mutenge
Using a custom function in chained polars code
pipe
Some functions you write in your code may be too specific to exist as built-in Polars methods or expressions. Fortunately, Polars provides a way to apply your custom…
2025-09-09
Joram Mutenge
I updated my polars course on udemy!
And why you should start learning polars
In October 2023, I published a comprehensive course on Udemy about using the Polars library. Polars is a Python library for analyzing data, and I’m convinced it will soon…
2025-09-04
Joram Mutenge
Power BI calendar order sorting on bars with month names
When you create a bar chart in Power BI with each bar representing a month name (for example, January for the first bar, February for the second, and so on), the bars are…
2025-09-03
Joram Mutenge
Add dynamic title to power BI chart
When you apply filters to your chart, such as filtering by month, having a static title like “January Sales” can be misleading if you later select February in your filter.…
2025-09-02
Joram Mutenge
FizzBuzz in 3 ways with python
And my favorite way
Most tech jobs require a technical interview. For a long time, the FizzBuzz question was used to weed out candidates who didn’t have the technical chops.
2025-08-17
Joram Mutenge
Collapsing row values into a list in polars
to_list
Python is big on lists because they are one of the fundamental data structures of the language. It’s no surprise that data analysis tasks in Python almost always involve…
2025-08-16
Joram Mutenge
Get top values without sorting in polars
top_k
Sorting values is an expensive operation, especially when you have a large dataset. However, sometimes you have no choice but to sort the data, particularly when you need to…
2025-08-15
Joram Mutenge
Collect text data into a list in polars
implode
Long format data (data with many rows) is good for performing analyses but bad for presentation. If you want people to easily understand your data, you should strive to…
2025-08-14
Joram Mutenge
Using quantile to filter data in polars
quantile
If you’ve ever taken the SAT, ACT, or GMAT, you might have wondered what percentile you scored in. A percentile is a way of describing a score’s position in a dataset…
2025-08-13
Joram Mutenge
Get unique values in a column in polars
unique
If one value in a column is overrepresented, you might think it’s the only value present since Polars displays only the first five and last five rows of the dataframe. To…
2025-08-12
Joram Mutenge
Using contains to filter data in polars
contains
The dirty secret is that data work is mainly about working with text data rather than numerical data. That’s why knowing how to filter text data is a valuable skill to have.…
2025-08-11
Joram Mutenge
Turn a polars series to a dataframe
to_frame
In Polars, a series is a one-column table, while a dataframe is a multi-column table. However, it’s possible to convert a series into a dataframe. Below is a series of cities.
2025-08-09
Joram Mutenge
When you want to count values without null in polars
pl.count
Most of the time, when you’re counting the number of values in a column, you’re not interested in including empty (null) values. Therefore, simply counting the number of…
2025-08-08
Joram Mutenge
Using polars selectors to filter dataframes
polars.selectors
Selecting specific columns to filter out unnecessary columns is common in data analysis. Polars makes this type of filtering straightforward through the use of selectors.…
2025-08-07
Joram Mutenge
Turn a matrix of data to a polars dataframe
from_records
In data science and analysis, storing data in an array or nested arrays (a matrix) is a common practice. Unfortunately, performing operations directly on arrays can be…
2025-08-06
Joram Mutenge
Get middle rows from a polars dataframe
slice
We all know how to get the first or last five rows of a dataset. But did you know you can also retrieve the middle rows? Below is a dataframe showing cereal brands:
2025-08-05
Joram Mutenge
Display thousand values with a comma separator in polars
pl.Config.set_thousands_separator
It’s easier to read large numerical values when they’re separated by a comma every three digits. For instance, your brain can more easily comprehend
5,000,000
at a glance…
2025-08-04
Joram Mutenge
Take a glimpse into your data with polars
glimpse
I’ve said it before, and I’ll say it again: it’s important to know the data you’re working with before you start analyzing it. Below is a dataframe showing cereal brands.
2025-08-03
Joram Mutenge
Checking the number of columns in your dataframe in polars
width
Sometimes your dataset may have too many columns to display on the screen at once. However, you might still want to know how many columns it contains. The Polars dataframe…
2025-08-02
Joram Mutenge
How to filter with empty to get true or false values in polars
is_empty
You’re conscious about your calorie intake, and you want to know whether there are any cereals in your dataset with more than 200 calories. How would you go about answering…
2025-08-01
Joram Mutenge
Identify and remove duplicate rows in polars
is_duplicated
Duplicates are a common problem in most datasets. That’s why it’s important to check for duplicate rows before analyzing your data. Fortunately, Polars provides an easy way…
2025-07-30
Joram Mutenge
Checking dataset memory usage in polars
estimated_size
It’s important to know how much memory the dataset you’re processing is consuming on your machine. Why? Because lower memory consumption leads to faster processing.…
2025-07-29
Joram Mutenge
Getting summary statistics in polars
describe
Data exploration is the first step in any data analysis task. You can’t start analyzing your data without understanding what it’s about. If you have numerical columns, one…
2025-07-28
Joram Mutenge
Thinking in tables
The mark of a 10x data analyst
In my last year of graduate school, I asked my professor what the most import skill a great data analyst should have. His response shocked me because I’d never thought about…
2025-07-26
Joram Mutenge
Combine dataframes with inner join in polars
inner join
Just like in SQL, it’s possible to join two dataframes in Polars. In this article, I’ll show you how to use the
inner
join in Polars to create a dataframe with more columns.…
2025-07-22
Joram Mutenge
Filter between a range of values in polars
is_between
It’s not always the case that you want to filter your data based on a single specific value. Sometimes, you may want to filter your data based on a range of values. Below is…
2025-07-21
Joram Mutenge
Retrieving a schema from a table in polars
collect_schema
In addition to showing column data types in the dataframe, Polars allows you to get a dictionary of data types where the key is the column name and the value is the data…
2025-07-18
Joram Mutenge
Counting how many times a value appears in polars
value_counts
When dealing with categorical data, you may want to know how many times each category appears in a column. Below is a dataframe containing three different categories of…
2025-07-17
Joram Mutenge
How to copy paste a table to a dataframe in polars
read_clipboard
As a data professional, you’ll work with many Excel files, and most of them will be poorly formatted. This makes it difficult to read the file into a dataframe. Fortunately…
2025-07-16
Joram Mutenge
Calculating cumulative sum in polars
pl.cum_sum
Say you have a target you want to hit for your weekly sales total, and you also want to know how close you are to hitting that target with each passing day. It turns out…
2025-07-15
Joram Mutenge
Filtering for multiple items in polars
is_in
Sometimes, you may want to filter data for more than one item. Polars makes this type of filtering straightforward. Below is a dataframe showing streaming services and their…
2025-07-14
Joram Mutenge
Group by calculations in polars
group_by
Aggregations to data professionals are what a saw is to a carpenter. Almost every data analysis you perform will involve an aggregate calculation, or
group_by
calculations…
2025-07-12
Joram Mutenge
Adding values across multiple columns in polars
sum_horizontal
Most dataframe libraries are excellent at performing columnar operations, such as adding or multiplying values within a single column. However, there are times when you may…
2025-07-11
Joram Mutenge
How to sample data with polars
sample
Analyzing a very large dataset can be strenuous on your computer, especially if you don’t have a fast machine. Instead of overworking your computer and waiting a long time…
2025-07-10
Joram Mutenge
Stacking dataframes vertically in polars
vstack
Combining two dataframes into a single dataframe is a common operation in data analysis. Dataframes can be combined vertically (one on top of the other) or horizontally…
2025-07-09
Joram Mutenge
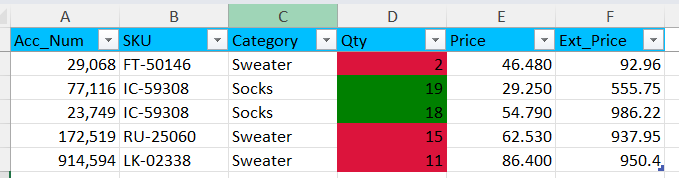
Adding conditional formatting to excel workbooks with polars
write_excel
Polars allows you to save data in multiple file formats like CSV, Parquet, Avro—even Excel. What most people don’t know is that you can add special formatting to the Excel…
2025-07-07
Joram Mutenge
Creating a datetime column from multiple columns in polars
pl.date
When you have a column with date values, having its data type as
datetime
is beneficial because it allows you to perform time series analysis on your data. You can slice the…
2025-07-06
Joram Mutenge
Keyboard time is the key to learning how to code
Most people say they want to learn how to code, but if you take a look at how they spend their time acquiring that skill, it makes you question whether they will ever become…
2025-07-04
Joram Mutenge
How to convert from pandas to polars dataframe
pl.from_pandas
Polars is highly versatile. It can accept a Pandas dataframe and convert it into a Polars dataframe. This conversion is especially useful when working with HTML data, as…
2025-07-03
Joram Mutenge
Maintaining a column name without retyping it in polars
name.keep
DataFrames make it easy to create new columns and rename existing ones. That’s why I prefer doing data analysis with DataFrames rather than SQL tables. Say we have a…
2025-07-02
Joram Mutenge
Joining text data with polars
pl.concat_str
Most people have a love-hate relationship with text data, but if you work in the data field, you’re bound to encounter it.
2025-07-01
Joram Mutenge
Getting every other row of the dataframe with polars
gather_every
There comes a time when you want to extract every other row from your DataFrame. What I mean is: get the first row, skip the second, get the third, skip the fourth, and so on.
2025-06-30
Joram Mutenge
How to know the number of days in each month with polars
dt.month_end
If I asked you, “How many days are in each month of the calendar?” most people would be able to answer for a few months, but not all.
2025-06-29
Joram Mutenge
Why aren’t more data people talking about ibis?
If you started working in the data field 20 years ago, you probably used a lot of SQL. It’s a robust, 50-year-old technology that excels at querying data, thanks to decades…
2025-06-25
Joram Mutenge
Converting unix timestamp to polars datetime
pl.from_epoch
Computers are good at recording timestamps, but they do it in Unix time. Sadly, humans aren’t great at interpreting Unix time.
2025-06-24
Joram Mutenge
Adding a currency symbol to polars dataframe values
pl.format
When your dataframe contains monetary values such as budgets it’s helpful to include a currency symbol. This ensures your audience clearly understands whether the figures…
2025-06-23
Joram Mutenge
Turning a polars dataframe to long format with explode
explode
Tabular data is easier to process when columns contain singular values of the same data type for each row. However, sometimes data can be stored as a list in a single row.
2025-06-20
Joram Mutenge
Arranging columns in a specific order using index in polars
pl.nth
Stacking dataframes vertically only works when the column names are the same and arranged in the same order. For example, if you have
df1
with columns
Name
and
Age
, and
df2
w…
2025-06-19
Joram Mutenge
How to remove whitespace in column values using polars in python
strip_chars
In data science or data analysis, counting unique values is very common. However, having whitespace (empty space at the beginning or at the end) in your values can lead to…
2025-06-18
Joram Mutenge
Your beautiful code doesn’t matter anymore (and that’s fine)
Your code doesn’t run in a vacuum. Your tools, your projects, your career all depend on a fast-moving ecosystem of languages, libraries, platforms, datasets, and now, AI.
2025-06-12
Joram Mutenge
Most data analysts are stuck using mediocre tools thanks to the familiarity trap
Data analysts aren’t exactly known for their technical wizardry – at least not if “technical” means writing actual code that doesn’t make software engineers weep. In fact…
2025-06-01
Joram Mutenge
Idea person or Thoughtful person: Which one are you?
If you’re working in an organization, you can’t escape meetings. They are part and parcel of day-to-day life in any workplace. But sometimes, it can feel like all you ever…
2025-05-25
Joram Mutenge
The single most important lesson I learned from my retired boss
The day my boss retired, a small part of me died.
2025-05-18
Joram Mutenge
Let me be the new host of The Data Scientist Show
I messaged Daliana Liu, host of
The Data Scientist Show
, on LinkedIn asking to become the new host. If you know her, please share this post so she sees it.
2025-04-26
Joram Mutenge
I made my first pull request to the Marimo team
If you work extensively with data in Python, you’ll agree that Jupyter notebooks provide an excellent environment for data analysis. I’ve used Jupyter notebooks for a long…
2025-03-03
Joram Mutenge
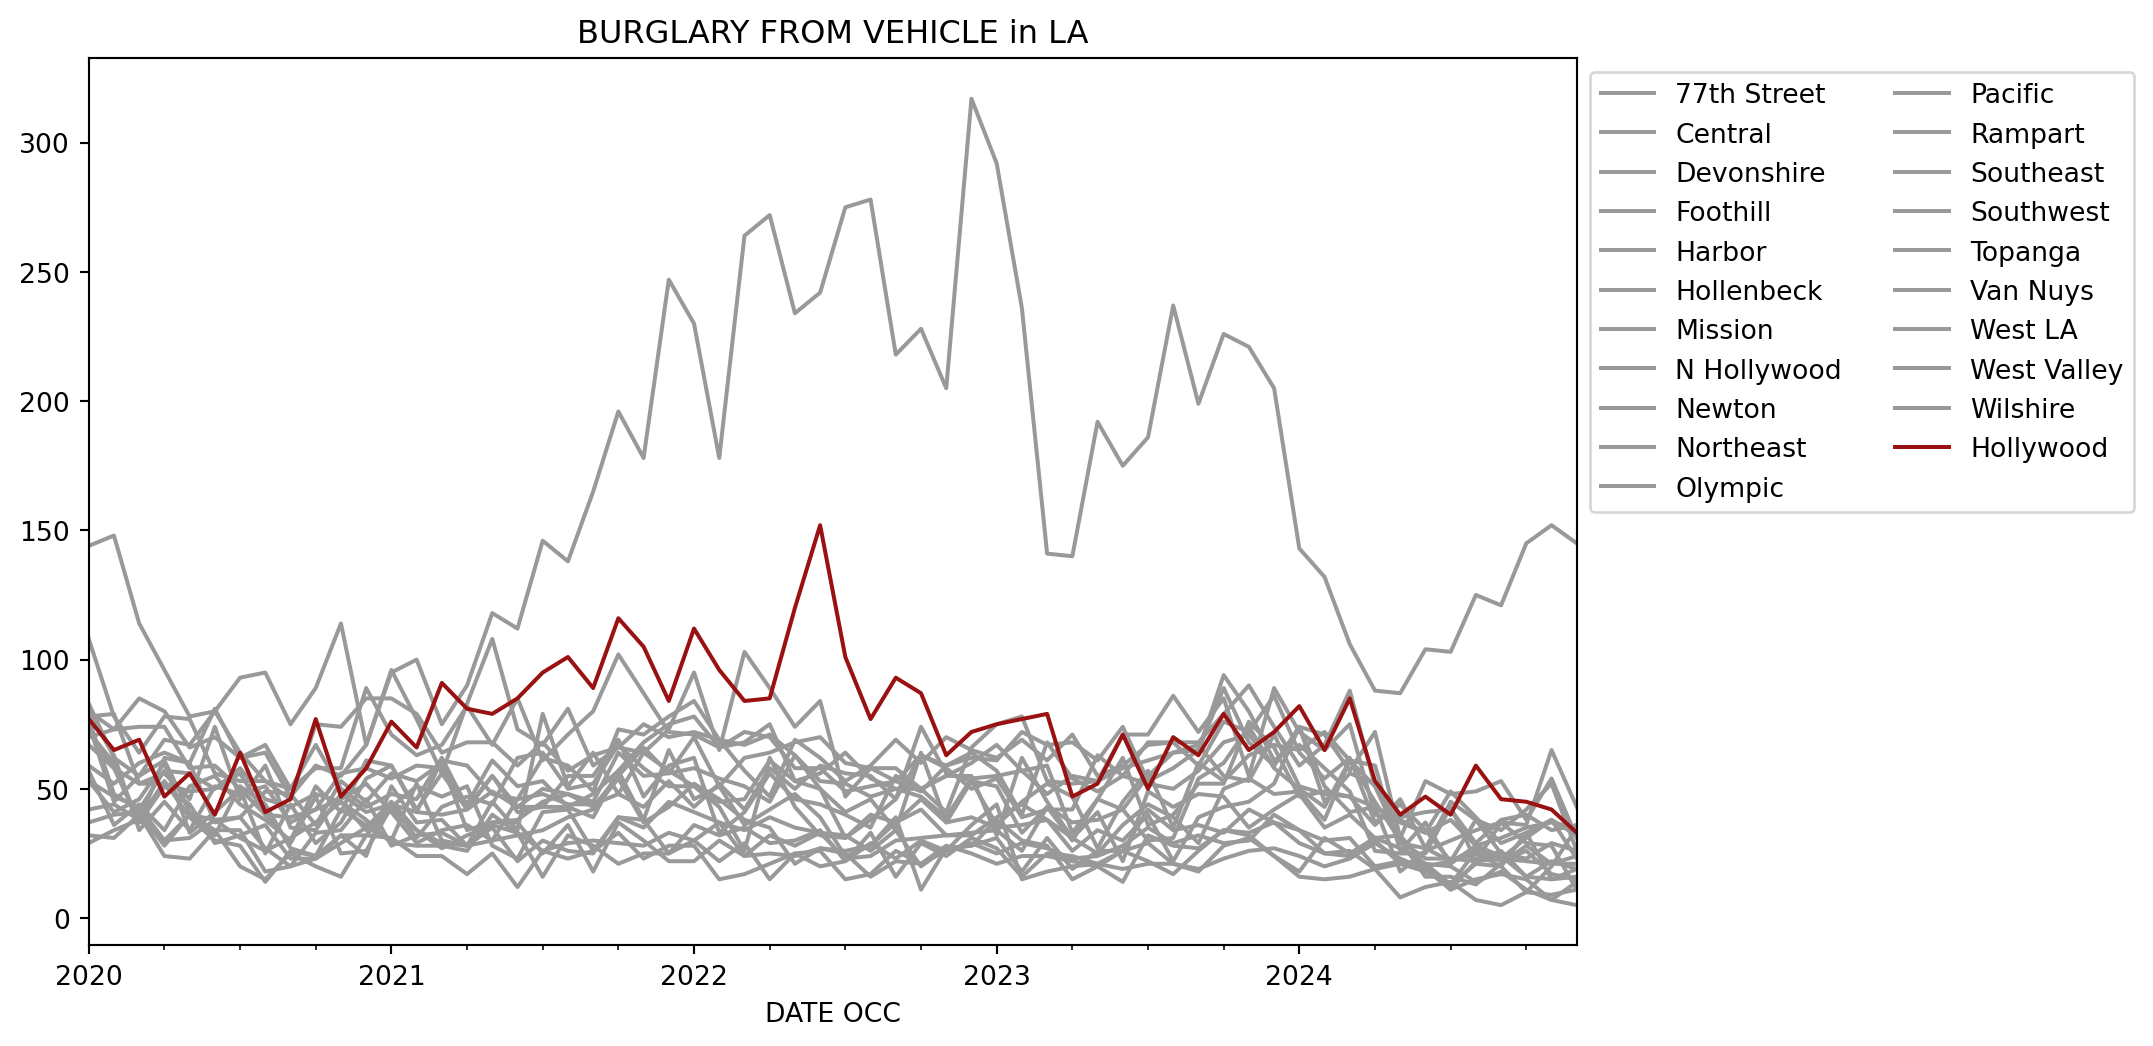
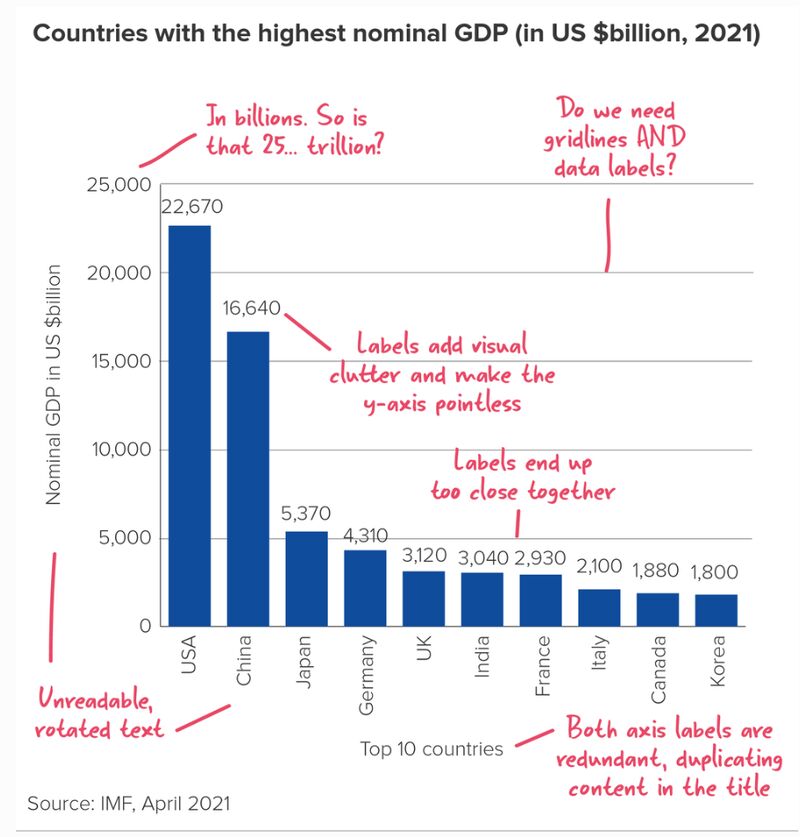
How to improve a bad graph with plotly
All data visualizations should, first and foremost, inform. Any visualization that falls short of this is simply data art. Data visualizations that are uninformative may be…
2025-02-25
Joram Mutenge
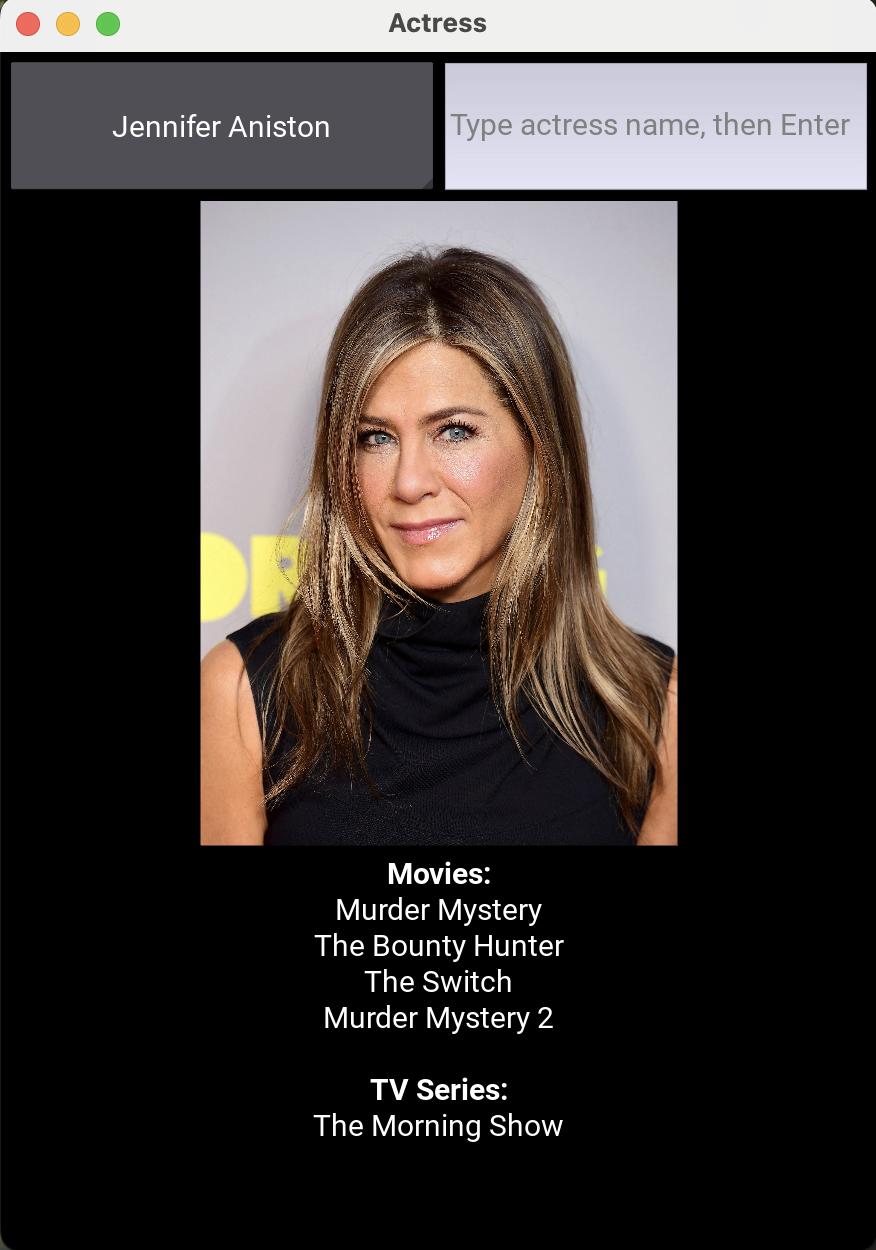
Creating a desktop app using kivy in python
I love watching movies and TV shows, but there are just too many out there that it’s often difficult to pick what to watch. For years, I’ve been updating my database of…
2025-02-22
Joram Mutenge
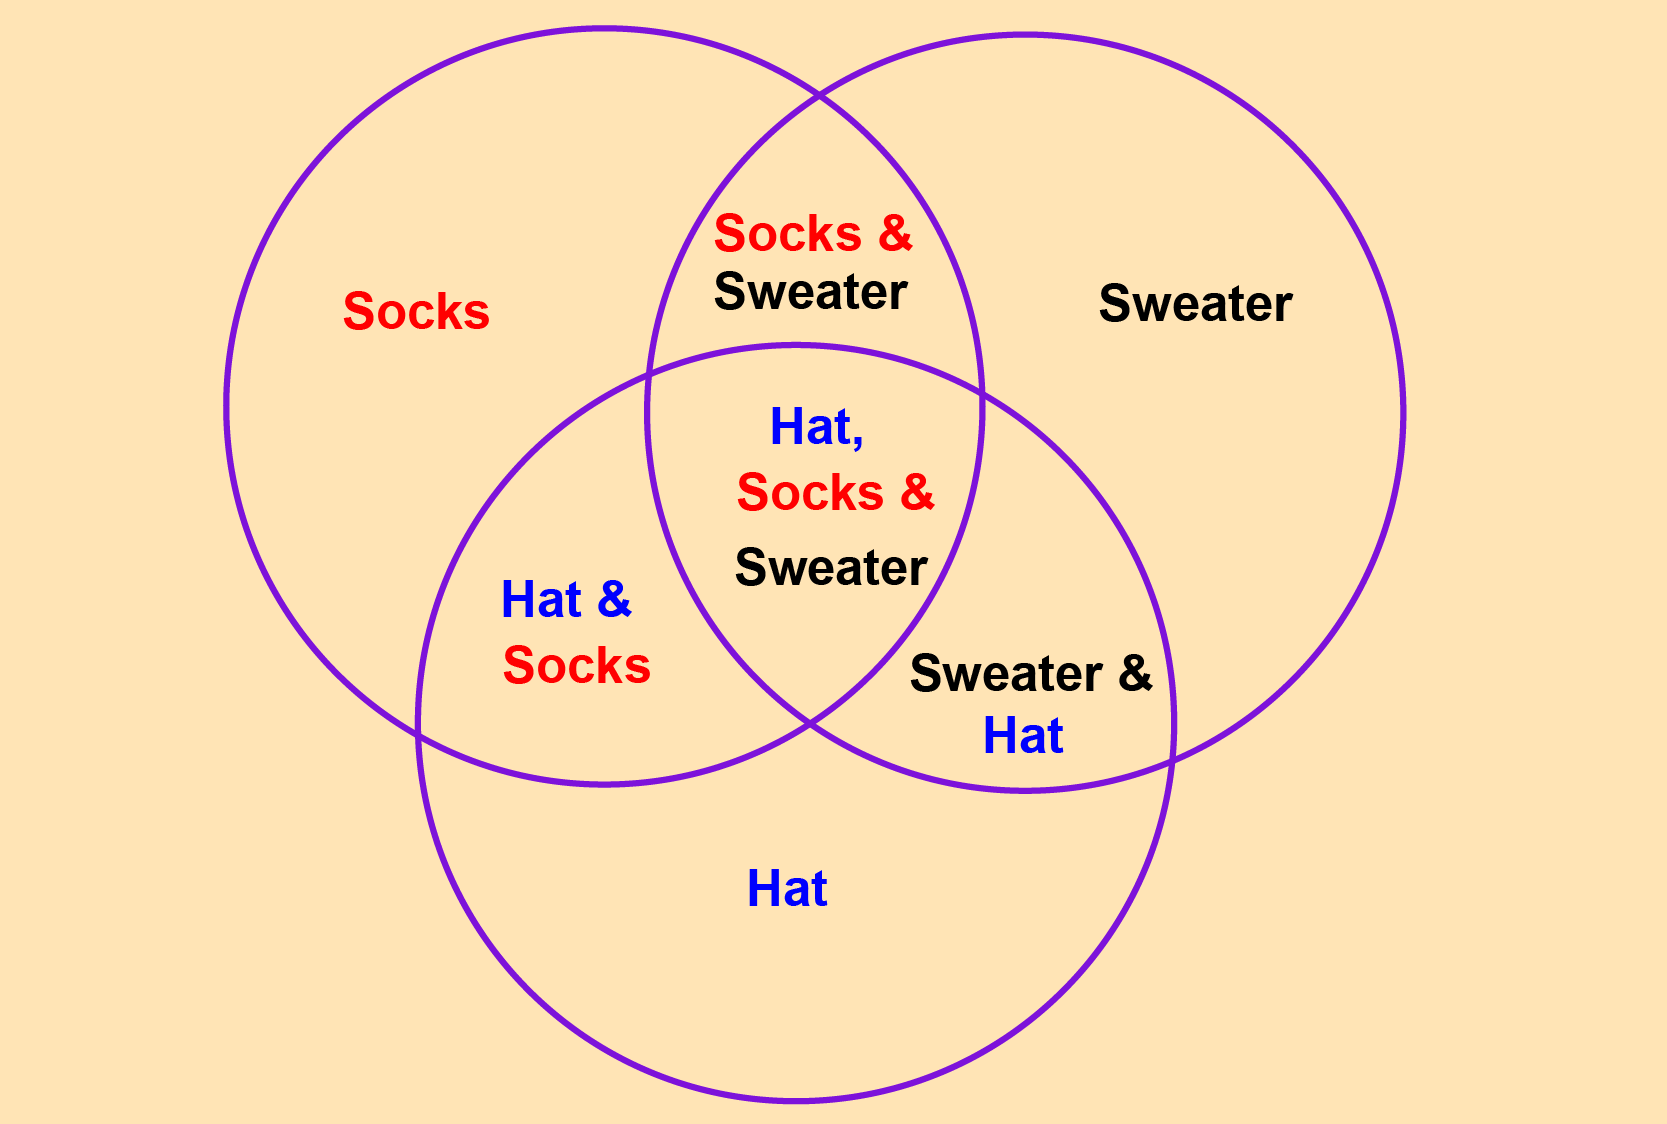
Using set theory to speed up your data analysis
Most data analysis tasks involve joining tables to get more data or filter out specific data. But what happens when the data you’re working with isn’t in a format that…
2025-02-09
Joram Mutenge
How overlooking a small detail on a job interview can disqualify you for a position
A month ago, I interviewed a candidate for a junior data analyst position. Given how difficult it is to land an interview in the data field due to stiff competition, I…
2025-02-01
Joram Mutenge
Ten polars functions that pros use and amateurs don’t
Polars is increasingly becoming a popular data analysis library, and my prediction is that more new data scientists and analysts will be starting with Polars rather than…
2025-01-13
Joram Mutenge
Tranforming timeseries data with group by and group by dynamic in polars
Polars has become my go-to library for data analysis. Each client project brings new insights into the powerful functionality Polars offers. Recently, I worked on a project…
2025-01-06
Joram Mutenge
What I learned about group by dynamic in polars while working on a client’s project
In the last client project I worked on, I learned something about the
group_by_dynamic
function in Polars. While what I learned was surprising, the fact that I learned it…
2024-12-30
Joram Mutenge
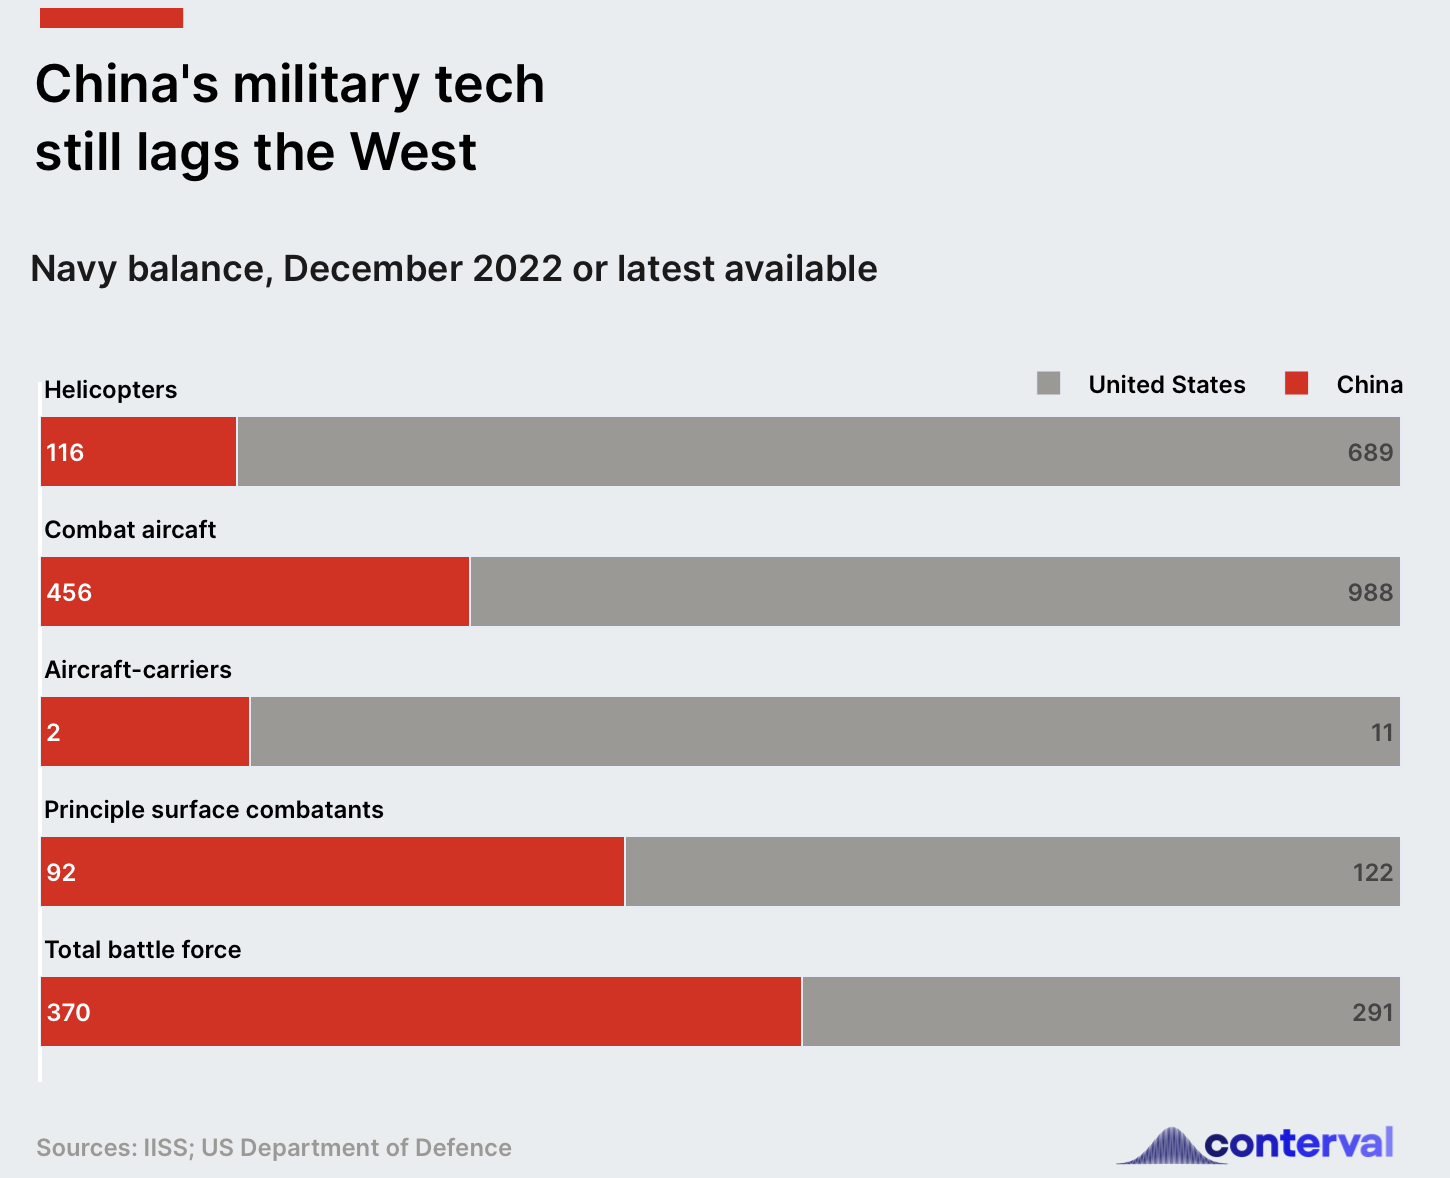
How to create charts from The Economist magazine using plotly
We at Conterval have always been fans of the charts from
The Economist
magazine. No publication does a better job of creating static visualizations you can use in print. We…
2024-12-15
Joram Mutenge
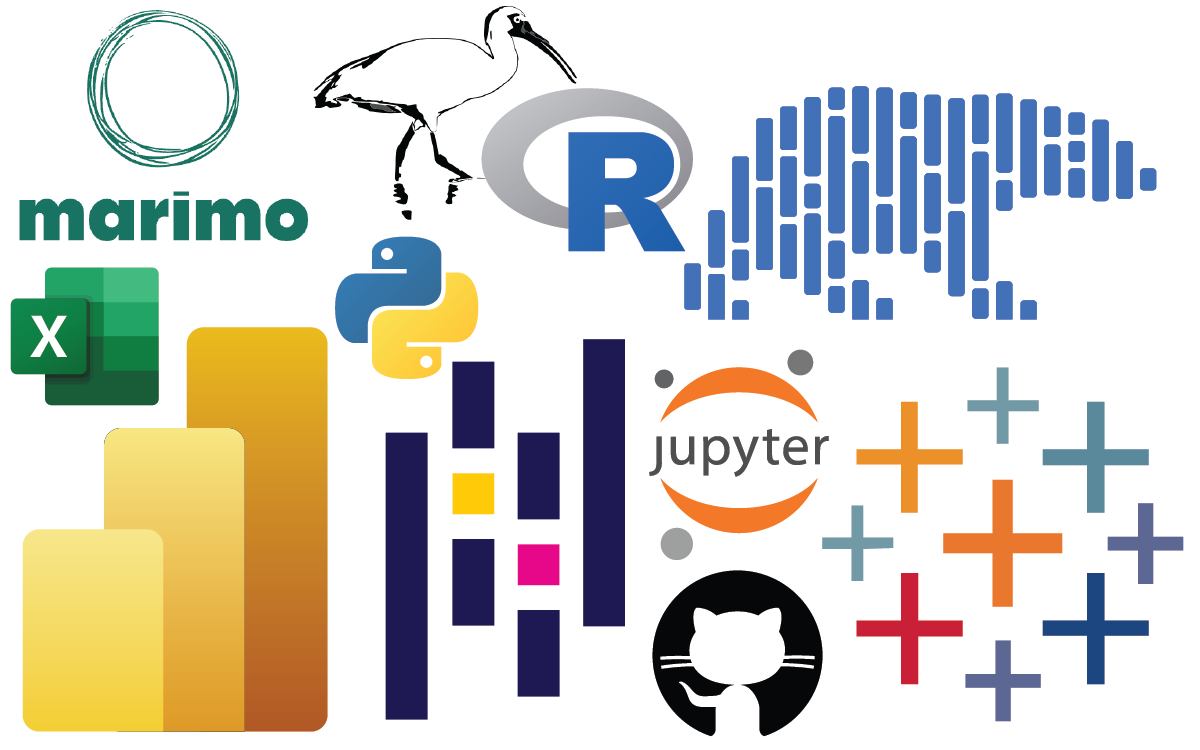
What tool should you use as a data analyst?
Data analysis is a hot field nowadays. Companies are opening up new data analyst positions, and many people want to become data analysts.
2024-12-01
Joram Mutenge
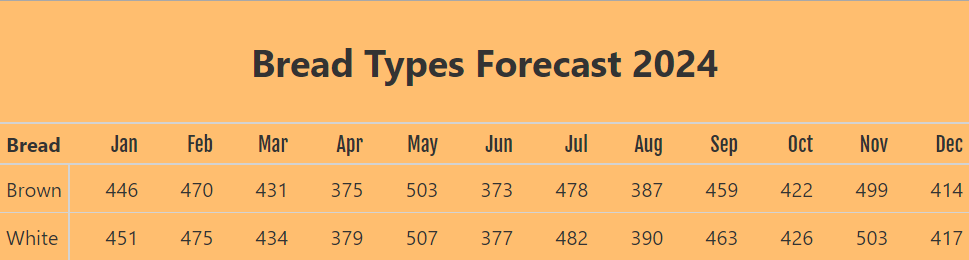
How we helped a bakery generate forecast by bread type using polars
A few weeks ago, Conterval did a consulting gig for a medium-sized bakery. This bakery makes white and brown bread, which it sells to a major retail store here in the USA.…
2024-11-18
Joram Mutenge
No matching items